


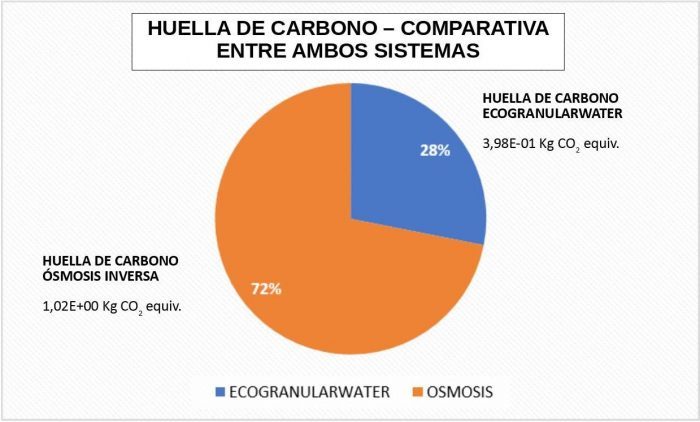
The carbon footprint of reverse osmosis is 2.5 times higher than that of the Ecogranularwater plant. The comparative environmental analysis has been developed through the Life Cycle Analysis methodology.
The scope of the analysis considered the construction phase, including the main construction materials for both plants and the transportation of these materials from the place of purchase to the location of the plants in Torre Cardela, and the production phase. The dismantling phase was not taken into account, as it is not significant.
Initially, in the results obtained from the infrastructure analysis, the plant developed by the ECOGRANULARWATER project proved to have greater impact than reverse osmosis, owing mainly to the larger volume of materials used during construction. To sum up, we can say that having greater mass incurs more impact, since the products used are similar.
However, the weight of infrastructure on the total impact over the useful lifetime of the plants represents only 1.61% in the case of the ECOGRANULARWATER plant and 0.01% in the case of osmosis. This indicates that the construction phase in both plants is not really significant in the overall impact generated, with the production phase being the dominant phase in terms of impact.
When comparing the Life Cycle Assessment impacts of both drinking water production processes, we observe that the impact of the ECOGRANULARWATER plant equates to 28% compared to 72% for reverse osmosis.
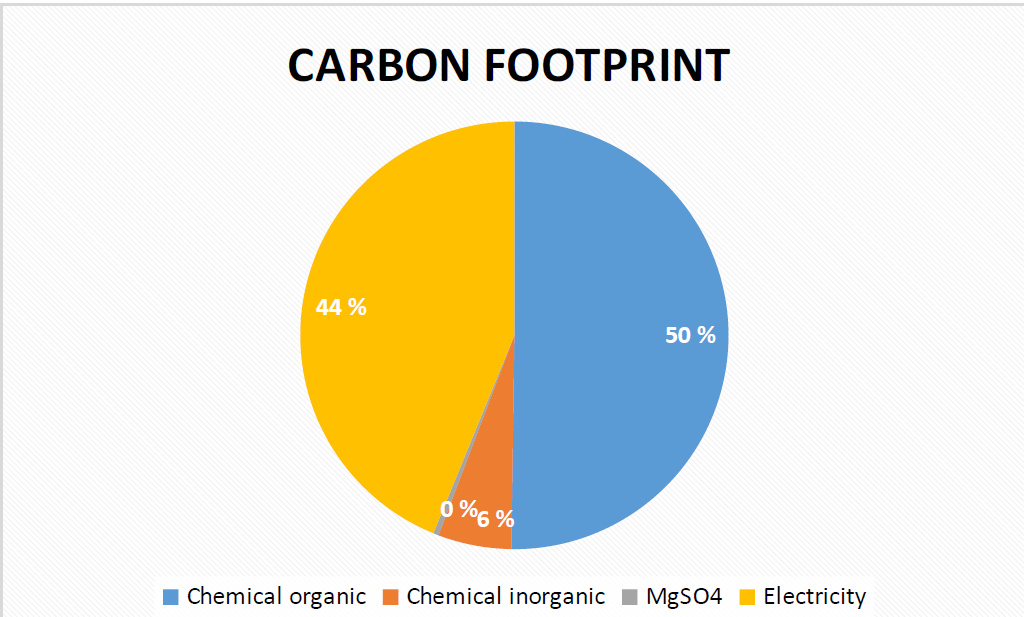
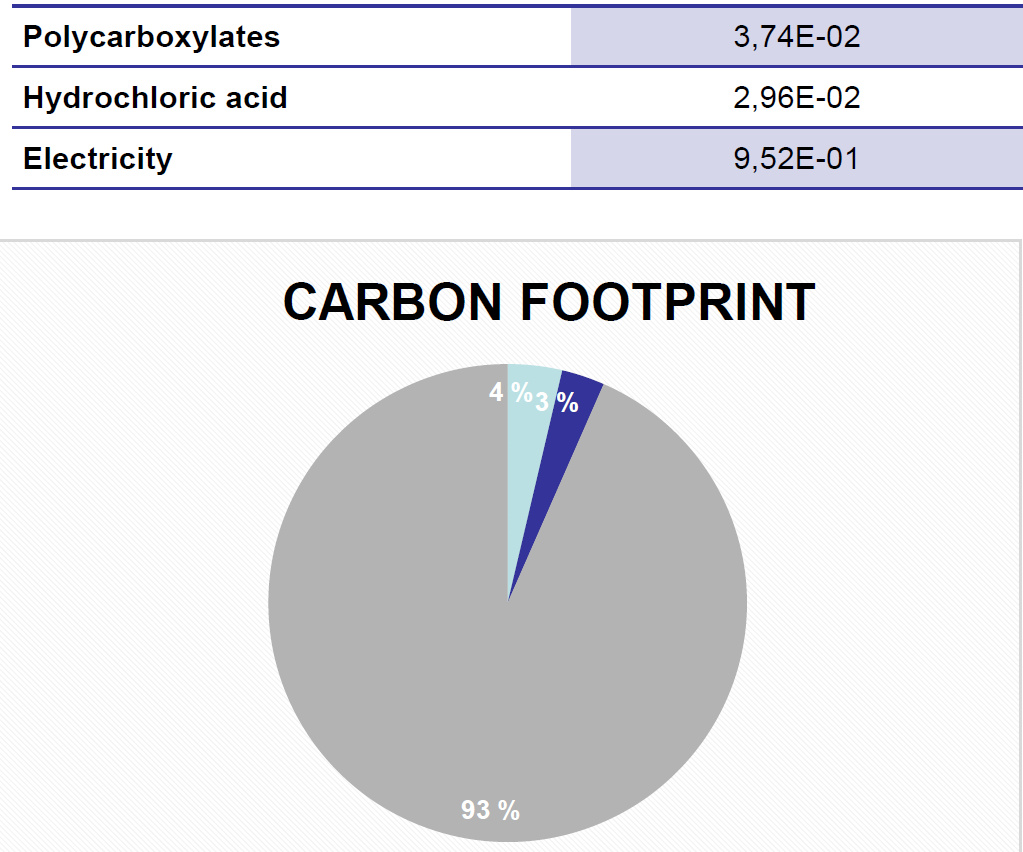
To sum up, in the ECOGRANULARWATER plant, the main inputs with an impact on its Carbon Footprint are organic salts in first place followed by electricity consumption, with these results being replicated in the various impact categories of the Environmental Footprint. In the case of reverse osmosis, the main impact-generating input is electricity, which represents 93% of the impact on the Carbon Footprint and is also replicated in the Environmental Footprint for the selected impact categories.
ECOGRANULARWATER PLANT REVERSE OSMOSIS PLANT
Bearing the above comparison in mind in addition to the impact generated by the infrastructure, practically the same result is obtained: 28% for the ECOGRANULARWATER plant compared to 72% for the reverse osmosis plant. As initially stated, the impact of infrastructure on the overall impact in the life cycle analysis is virtually insignificant. Therefore, an average reduction of 60% in both carbon footprint and environmental footprint is obtained with the treatment carried out by the ECOGRANULARWATER plant. It is estimated that there is still room for improvement, since the comparison was made based on a pilot model that has the potential for greater efficiency.